Industrial Equipment Predictive Maintenance Platform
Product Details
1 Equipment Registration
1.1 Login
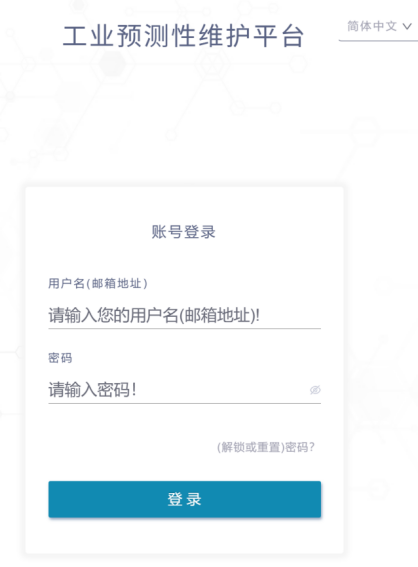
Figure 1-1 Login screen
1.2 Creating Assets
- On first entry the asset tree is empty. Click the Create Asset button as shown, fill in the asset information; assets at this level represent factories, and the asset name can be the factory name.
- Create a workshop asset: select the corresponding factory, then click New Sub-level and fill in the workshop information.
- After the workshop is created, select it, click New Sub-level to start creating a unit, fill in the unit information in turn, and add a photo of the unit nameplate.
- After the unit is created, click Upload Photo on the unit screen to upload a photo of the unit.
- To register a sensor, first select the corresponding unit, click New Monitoring Device, enter the device number (which can be scanned from the sensor’s QR code), then fill in the monitoring-point name, sensor model and power-supply method according to the monitoring-point information.
- The sensor number and model are marked on the sensor label.
- The monitoring-point name can describe the actual installation position for easy later lookup.
- After the device is bound, contact our staff to configure it; once configured, abnormality diagnosis can proceed normally.
1.3 Sensor Configuration
- Sensor configuration includes basic configuration and advanced configuration. Basic configuration relates mainly to how the sensor works; advanced configuration sets algorithm parameters according to the actual condition of the machine at the monitoring point. Select the sensor and click the Configuration File tab to enter the basic configuration screen.
Machine size type: select the machine size type based on the power of the machine at the monitoring point.
Device operating mode: timed inspection mode and continuous monitoring mode.
- Timed inspection mode: simulates manual inspection. When the wake-up time arrives, the sensor performs one data-acquisition diagnosis of the machine and reports one diagnosis result.
- Continuous monitoring mode: the sensor works continuously, monitoring machine health in real time. Note that although the sensor runs continuously, it does not report a diagnosis result on every run — only when the machine’s operating state changes markedly or the health index changes markedly. This mode can only be used with mains-powered sensors.
Re-learn device state: resets the sensor’s self-learning function. Normally this switch should be turned on once after the device is installed. It can also be turned on after the machine is repaired, so the sensor re-learns.
Wake-up mode: timed wake-up, interval wake-up, staggered wake-up.
- Timed wake-up: based on 00:00 each day, the sensor wakes to work when the current time is an integer multiple of the wake-up interval.
- Interval wake-up: based on the sensor’s current sleep time, the sensor wakes again after the wake-up interval.
- Staggered wake-up: on top of timed wake-up, adds a staggered time offset before waking.
- Advanced configuration
- Detection object: select the corresponding detection object according to the component at the actual installation point.
- Number of blades: required when the detection object is blades.
- Gear algorithm: required when the detection object is a gearbox. If the gearbox parameters are known, the spectrum algorithm can be selected; otherwise select the time-domain algorithm.
- Bearing type: rolling bearing or sliding bearing, chosen according to the bearing type at the installation point.
- Rolling-bearing algorithm: if the bearing model is known, enter the model and select the spectrum algorithm; if not, select the time-domain algorithm and enter NULL for the bearing model.
- Bearing quantity: single bearing or double bearing. If the installation point has two bearings, select double bearing and enter both models.
- Criterion for judging operating state: by default the vibration sensor is preferred.
- Threshold: enter the corresponding threshold for the selected criterion sensor. When the measured value exceeds the threshold, the sensor considers the machine to be running; otherwise it is not running.
- Speed algorithm:
- Calculate speed from vibration: the sensor calculates speed from the vibration spectrum; the speed range is generally the actual speed fluctuation range.
- Calculate speed from magnetic flux: requires the rated speed and the motor’s current frequency. Generally used at motor-side points.
- Direct reading of speed from magnetic flux: used only on special motors.
2 Daily Management Settings
2.1 Asset Hierarchy Settings
To ensure orderly management of sensor devices, assets are subdivided into 4 levels: factory -> workshop -> unit -> sensor. Sensor devices must be registered strictly at the 4th level, so that the hierarchy information directly locates the physical position of the sensor asset.
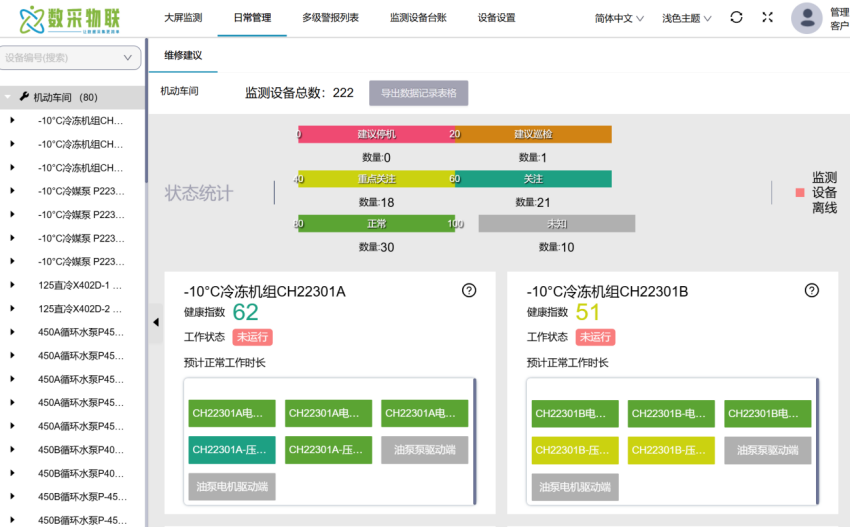
Figure 2-1 Example hierarchy page
The platform provides not only detailed monitoring data for each sensor, but also statistics for each level (unit, workshop and factory). To ensure sensible and effective statistics at the unit level, multiple sensors under the same unit must be installed on the same physical unit with consistent operating conditions. For example, for a motor-driven pump, the motor and pump should be treated as one unit, and sensors at different points on the motor and pump should be registered under the same unit level.
2.1.1 Factory Level Settings
Displays the health-index statistics of each workshop under the factory and provides recommended inspection levels for different health-index ranges. As shown in Figure 2-2, the factory has one workshop containing three units — one unit with unknown health status, one to watch, and one normal.
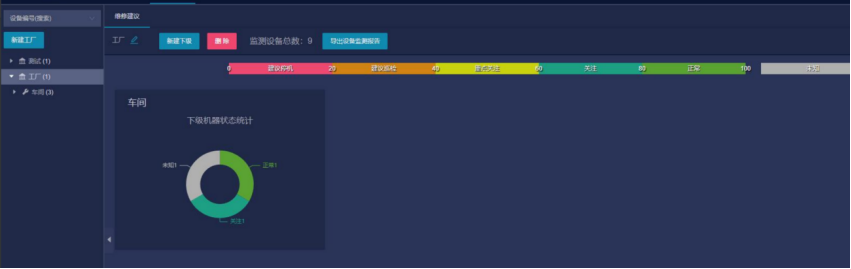
Figure 2-2 Factory-level statistics page
Choose Daily Management in the top menu -> select a specific factory. This screen shows the inspection advice for all workshops in the factory; five different colors represent the corresponding score ranges and equipment states: 0-20 red, recommended shutdown; 21-40 orange, recommended inspection; 41-60 yellow, key attention; 60-80 light green, attention; 80-100 green, normal.
2.1.2 Workshop Level Settings
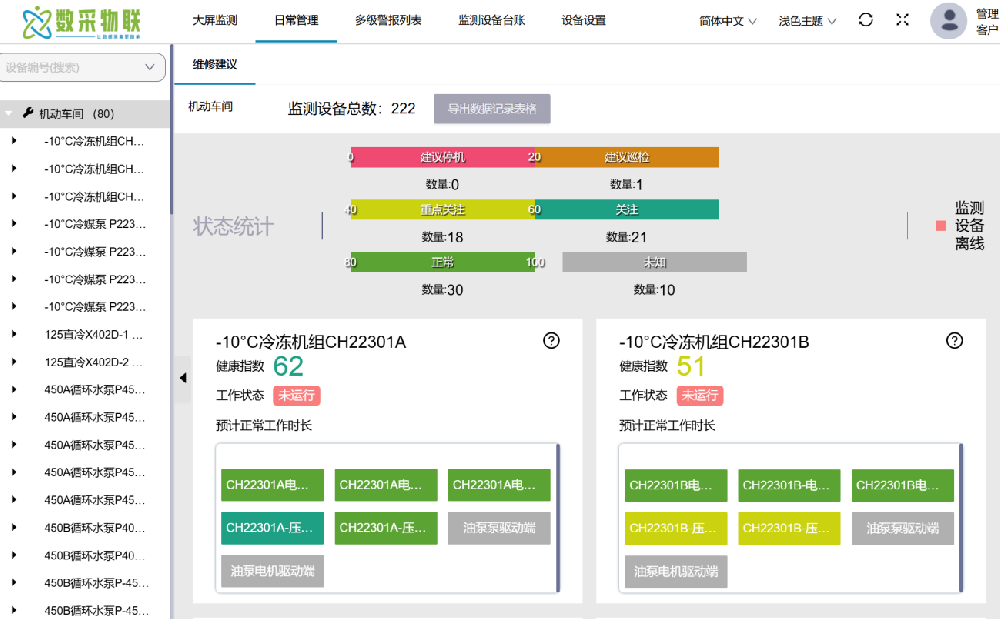
Displays the health index, working state and estimated working hours of each unit in the selected workshop.
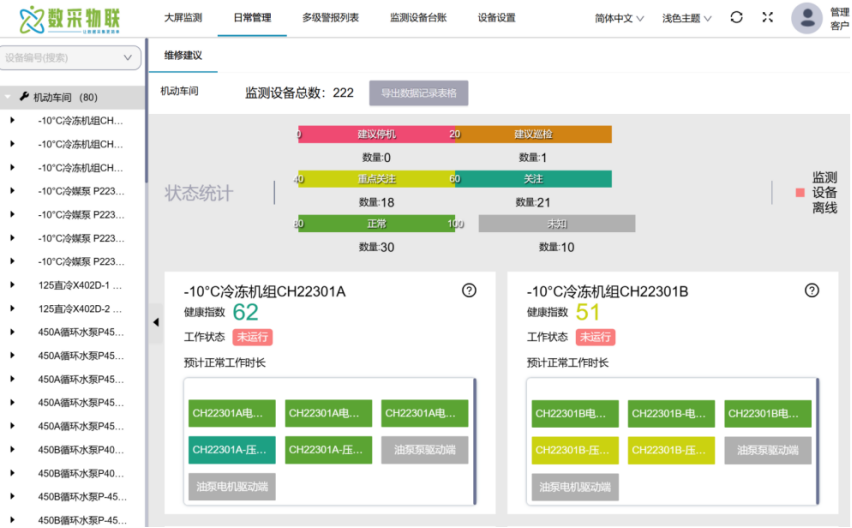
Figure 2-3 Workshop-level statistics page
Choose Daily Management in the top menu -> select a specific factory -> a specific workshop. Each workshop’s details are shown as a card, including workshop status, predicted normal working time and the status of units within the workshop. As shown in Figure 2-4, the point color corresponds to the health-index range at the top of the page. A point with a small red square at its upper left is offline; without the red square it is online.
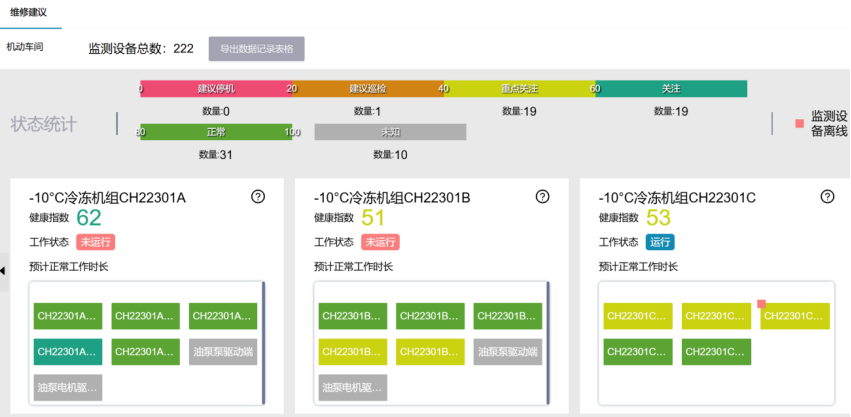
Figure 2-4 Example of offline device
2.1.3 Unit Level Settings
As shown in Figure 2-5, the upper left shows the health index of the current unit, the upper right shows the diagnostic-result statistics and online-status statistics of all points in the unit, and the lower part shows the specific diagnosis result and sensor online/offline status of each point in the unit. The unit health index reflects the worst health index most recently monitored among all points in the unit.
When the health status is “recommended shutdown”, the machine has a serious fault and the user should go on site as soon as possible and shut down for repair; in the “recommended inspection” and “key attention” states, the user is advised to check the machine on site and shut down for maintenance if necessary; in the “attention” state the machine usually runs fairly normally and no special attention is needed; in the “normal” state no action is needed.
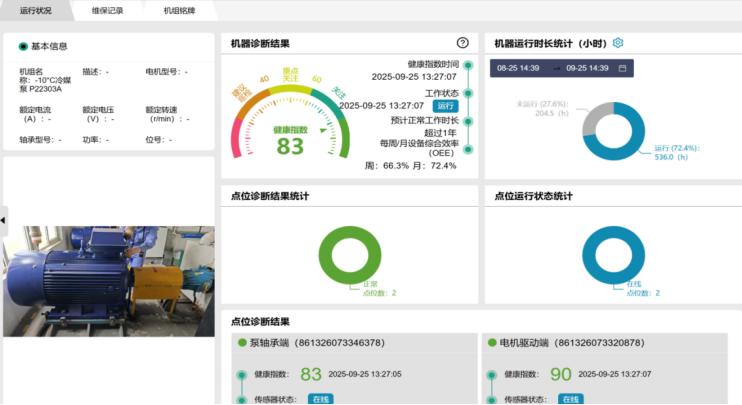
Figure 2-5 Unit-level statistics page
2.1.4 Sensor Point Settings
The sensor level displays the various diagnostic information monitored and analyzed at the current point: basic data such as speed, temperature and loudness, and their historical data; spectra such as vibration spectrum, sound spectrum and magnetic-flux spectrum plus their raw waveform data; and equipment health information such as fault diagnosis results and health scores, providing detailed reference information for equipment inspection and maintenance.
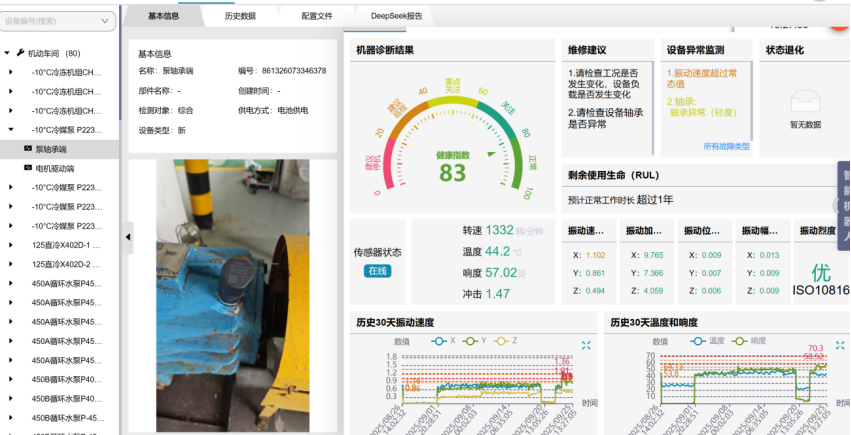
Figure 2-6 Sensor-level basic information page
2.2 Basic Information
The Basic Information page provides the basic operating results of the sensor’s monitoring point, vibration data, sound data, phase analysis, magnetic-flux data, bearing fault chart, gear fault chart and shaft-center orbit chart.
Note that the data shown on the Basic Information page is not always the latest data but the latest data in the machine’s “running” state; if the machine is not currently running, go to the Historical Data page to view the latest data.
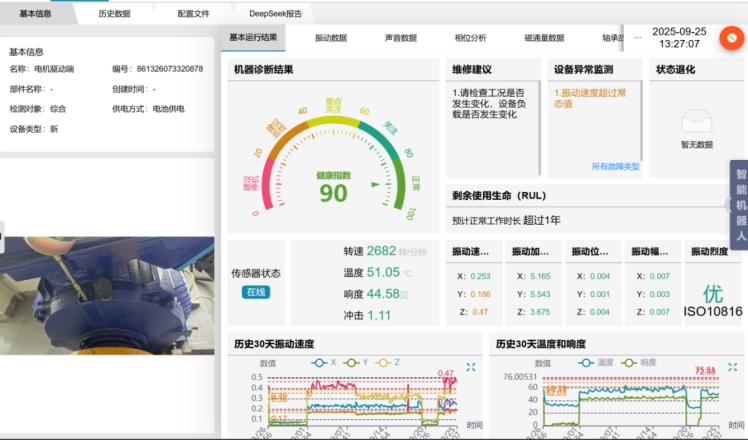
Figure 2-7 Basic information page
2.2.1 Basic Operating Results
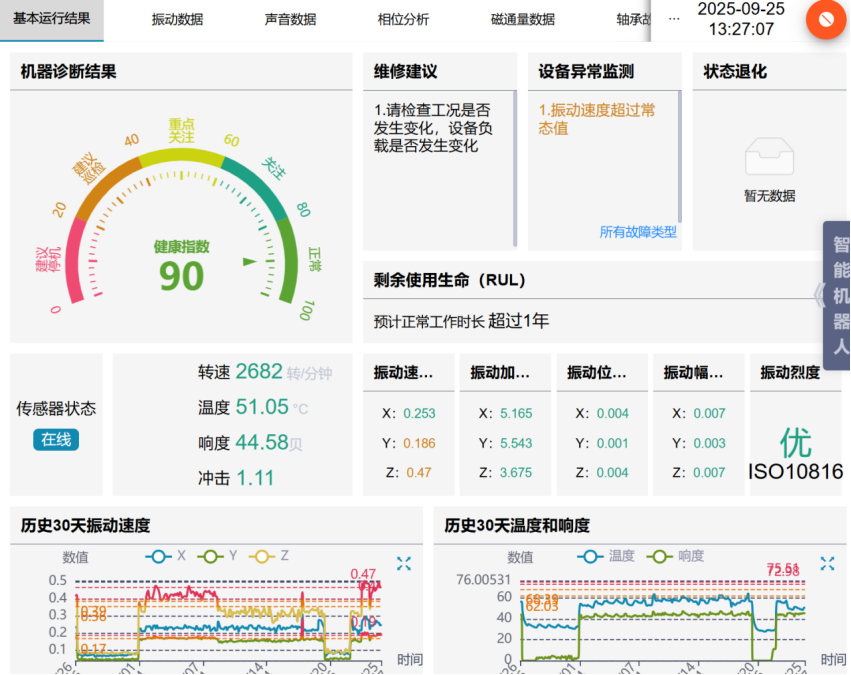
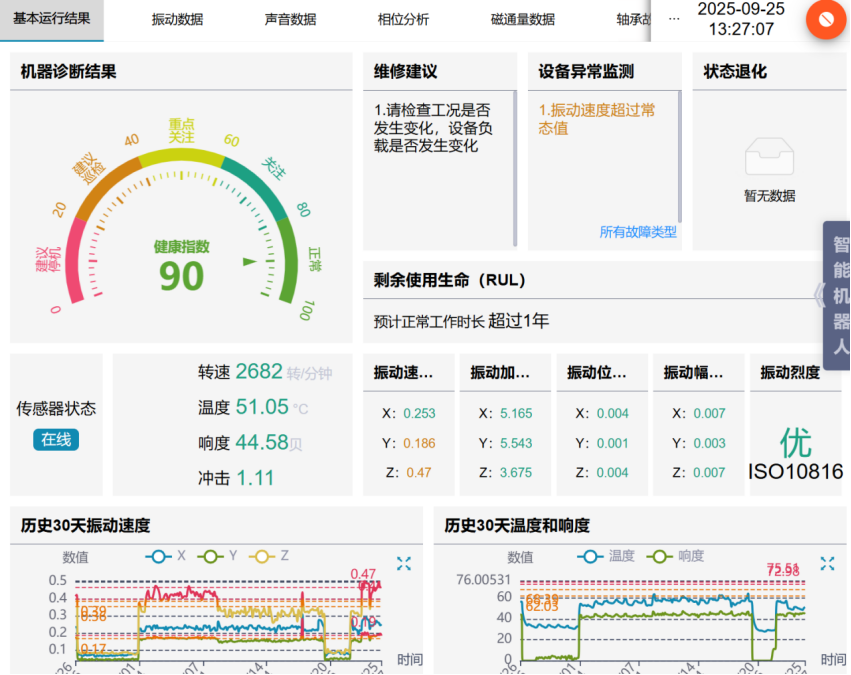
Figure 2-8 Basic operating results
- Machine diagnosis result: expresses machine health intuitively with a single health index. The health score is a composite indicator fusing equipment faults, vibration severity, SPC monitoring and other monitored data, letting users quickly grasp the machine’s current health and inspection recommendation. Health score: 0-20 red, recommended shutdown; 21-40 orange, recommended inspection; 41-60 yellow, key attention; 60-80 light green, attention; 80-100 green, normal.
- Maintenance advice: specific maintenance advice based on abnormal monitoring results, greatly shortening the worker’s inspection process.
- Equipment abnormality monitoring: lists abnormal indicators, fault types and their severity in detail.
- State degradation: lists abnormal trends in the monitoring data; an abnormal trend is likely a sign of degrading machine health.
- Remaining service life: the predicted remaining working hours derived from historical data trends, for the user’s reference.
- Monitoring-device status: shows the sensor’s online/offline status in real time.
- Basic values: speed, temperature, loudness and impact. Impact refers to the stability of the vibration signal; generally a value below 4 is normal for equipment, while reciprocating equipment tends to have a higher impact value.
- Last 30 days’ data: vibration velocity, temperature, loudness, health index, speed and daily overall equipment effectiveness. Daily OEE is the proportion of daily working hours; for example if the equipment ran 12 hours in a day, that day’s OEE is 50%.
- Vibration values: vibration velocity, acceleration, displacement and amplitude for the x, y and z axes (Figure 2-9).
- Vibration severity: derived from the ISO10816 international standard. As shown in Figure 2-11, the current motor’s maximum vibration velocity is 1.348mm/s on the z axis and the motor is a class-2 medium motor. Per ISO10816 the velocity falls in the light-green range, so the vibration severity indicator is shown as “good” on the platform page.
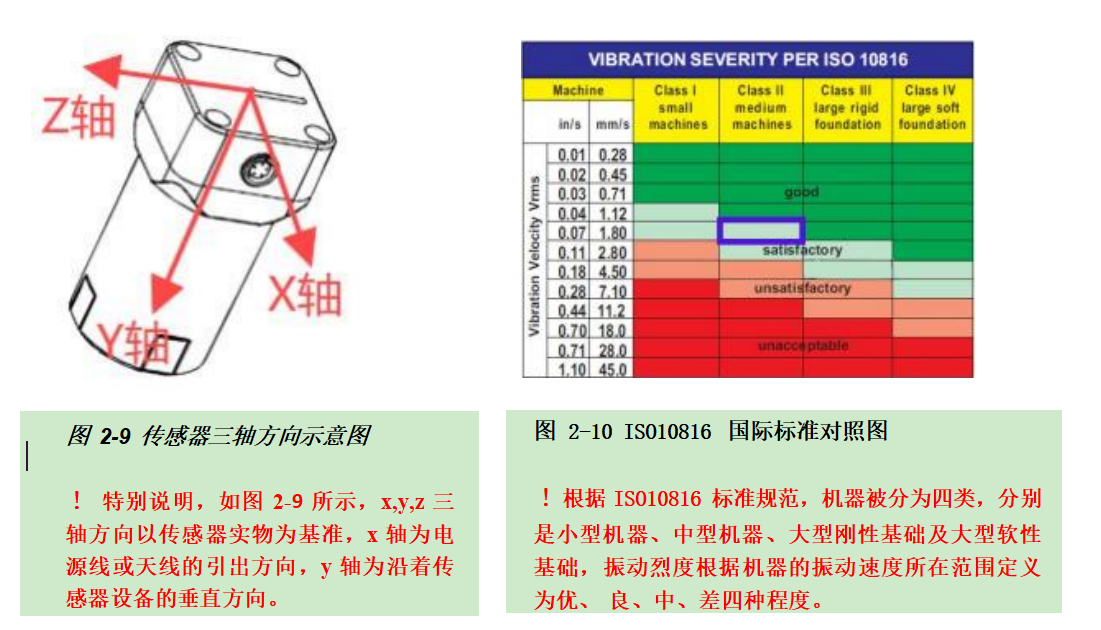
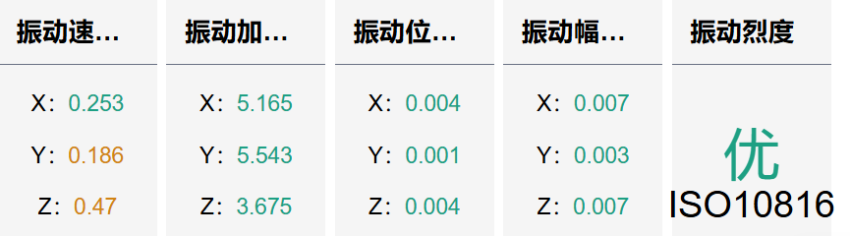
Figure 2-11 Platform vibration data illustration
2.2.2 Vibration Data
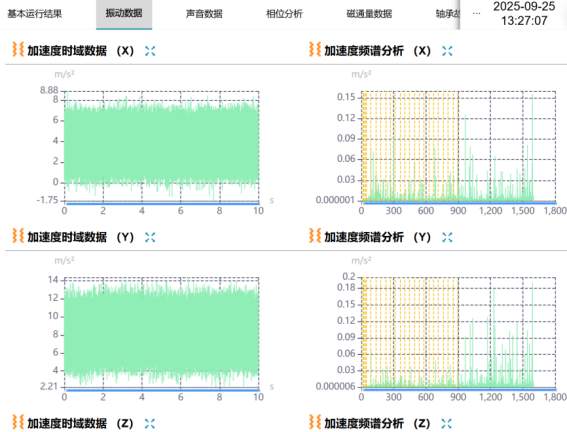
Figure 2-12 Vibration acceleration time-domain and spectrum data
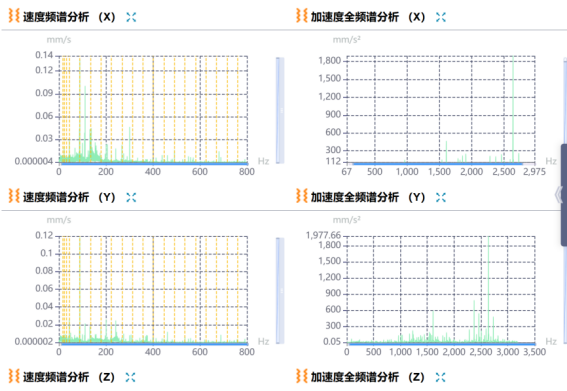
Figure 2-13 Vibration velocity spectrum and acceleration full spectrum
The Vibration Data page shows acceleration time-domain data, acceleration spectrum and velocity spectrum, plus the acceleration full spectrum at a higher sampling frequency for spectrum-analysis professionals.
Daily Management -> select a specific unit on the left -> select a specific point -> Vibration Data. This screen shows the vibration-acceleration time-domain and frequency-domain charts of the three axes at the monitoring point.
2.2.3 Sound Data
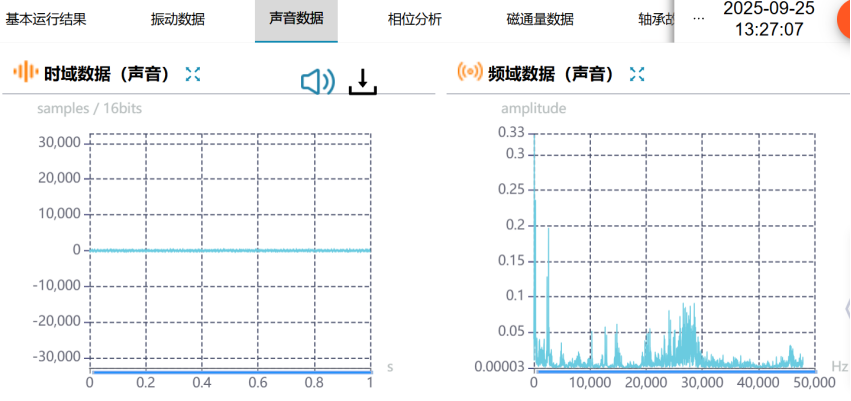
Figure 2-14 Sound time-domain data and spectrum
Daily Management -> select a unit -> select a point -> Sound Data. This screen shows the sound time-domain and frequency-domain data at the monitoring point. Click the speaker at the upper right of the time-domain data to play the recorded sound.
2.2.4 Phase Analysis
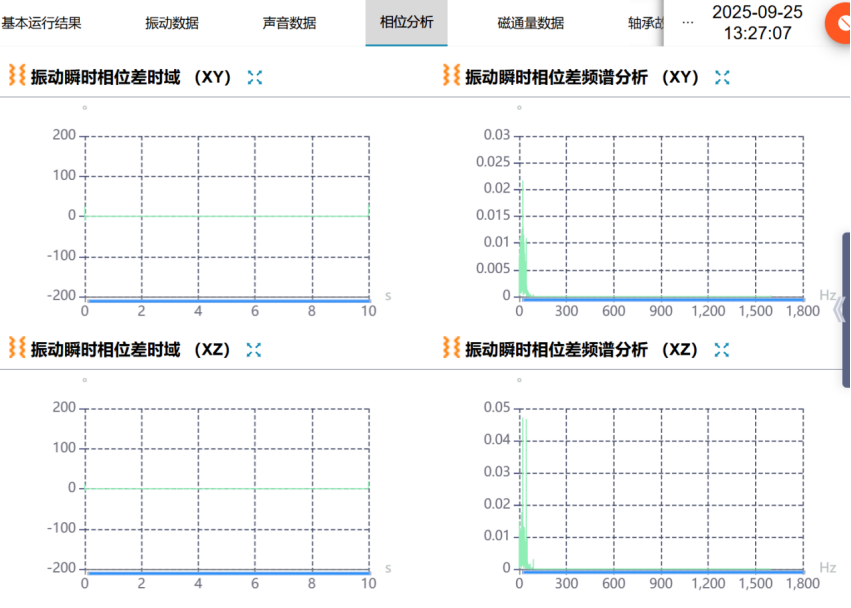
Figure 2-15 Vibration phase time-domain and spectrum data
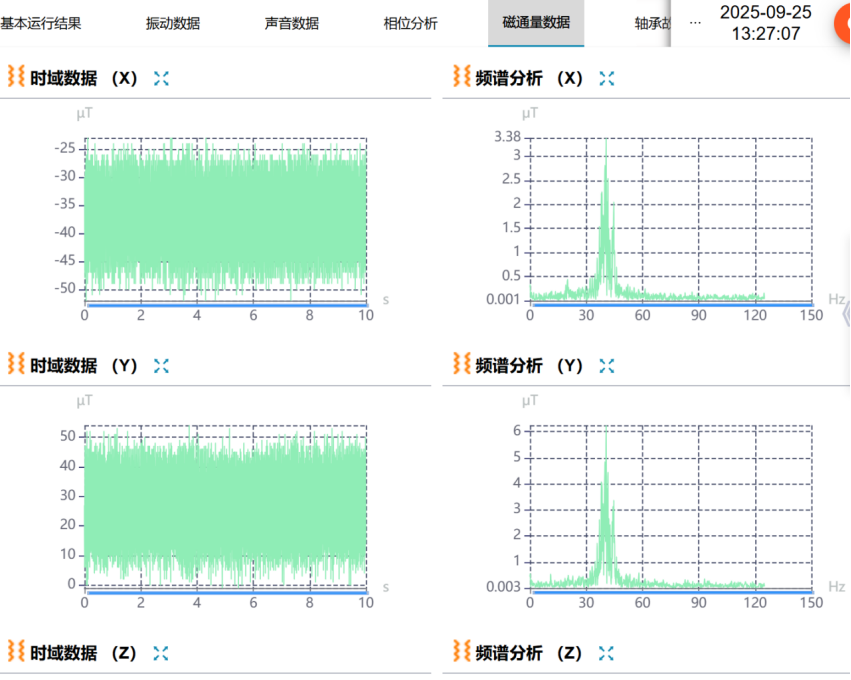
Figure 2-16 Magnetic-flux phase time-domain and spectrum data
Daily Management -> select a unit -> select a point -> Phase Analysis. This screen shows the phase time-domain data and phase spectrum of vibration and magnetic flux.
2.2.5 Magnetic-Flux Data
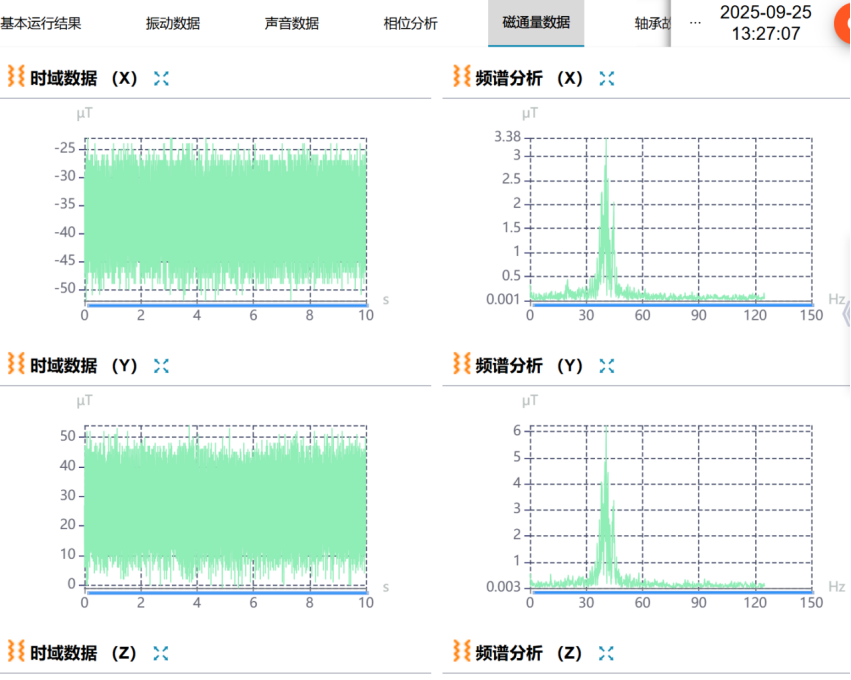
Figure 2-17 Magnetic-flux time-domain and spectrum data
Daily Management -> select a unit -> select a point -> Magnetic-Flux Data. This screen shows the magnetic-flux time-domain and frequency-domain charts of the three axes at the monitoring point.
2.2.6 Bearing Fault Chart
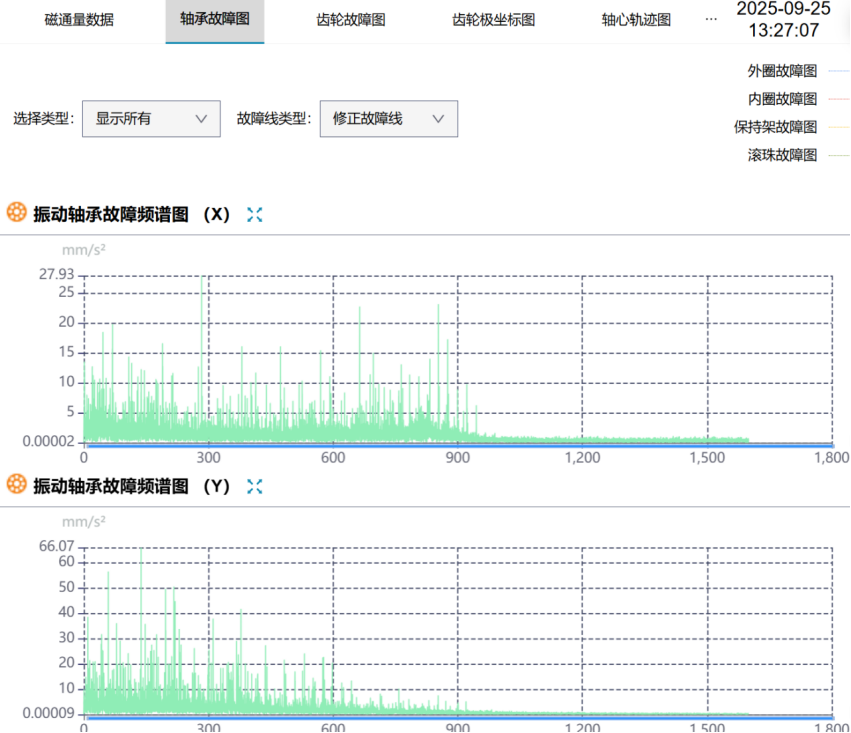
Figure 2-18 Bearing fault chart
Daily Management -> select a unit -> select a point -> Bearing Fault Chart. This screen shows the bearing fault spectrum. When the sensor’s monitoring object is a bearing, the page displays the bearing fault spectrum with auxiliary lines for inner-race, outer-race, cage and rolling-element fault frequencies; by comparing the spectrum with the auxiliary lines you can intuitively judge the bearing fault.
2.2.7 Gear Fault Chart
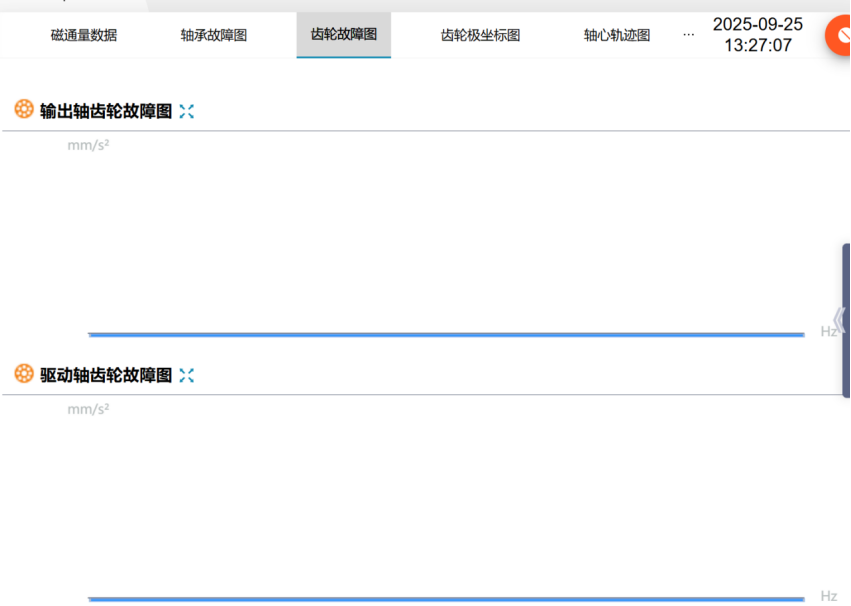
Figure 2-20 Gear fault illustration
Daily Management -> select a unit -> select a point -> Gear Fault Chart. This screen shows the gear fault spectrum when the sensor’s monitoring object is a gear.
2.2.8 Shaft-Center Chart
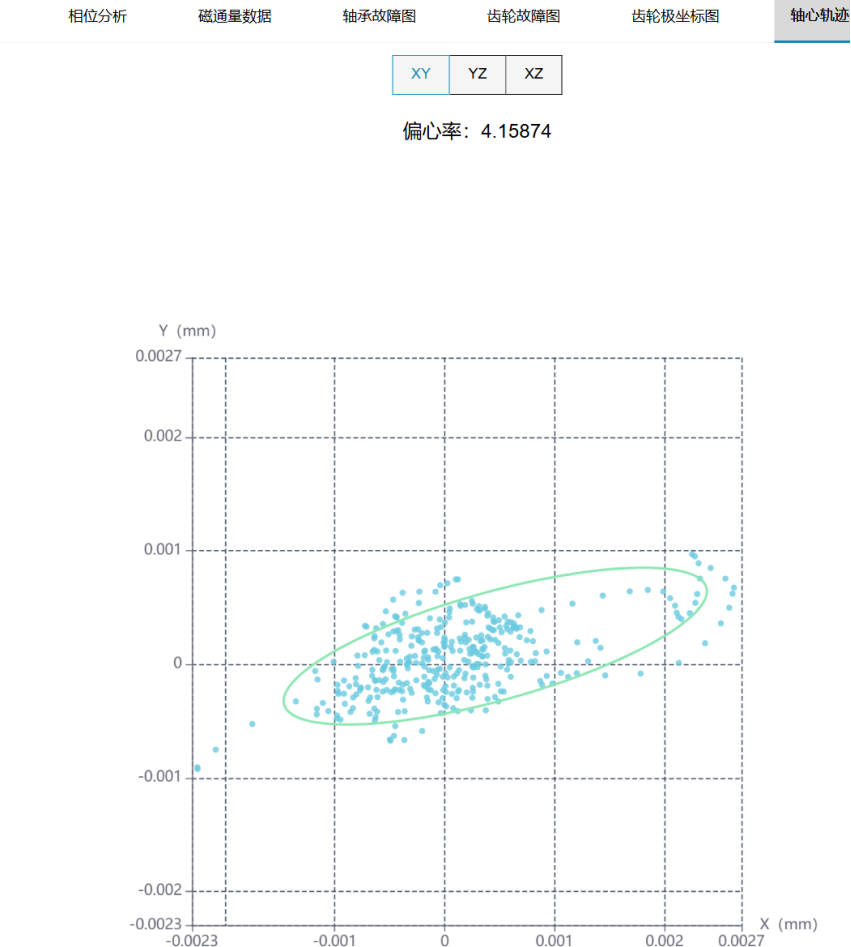
Figure 2-21 Shaft-center orbit chart
Daily Management -> select a unit -> select a point -> Shaft-Center Chart. The shaft-center orbit chart is a circular trajectory fitted from vibration displacement; the better the machine runs, the closer the orbit is to a true circle, and vice versa.
2.3 Historical Data
2.3.1 Historical Data Query
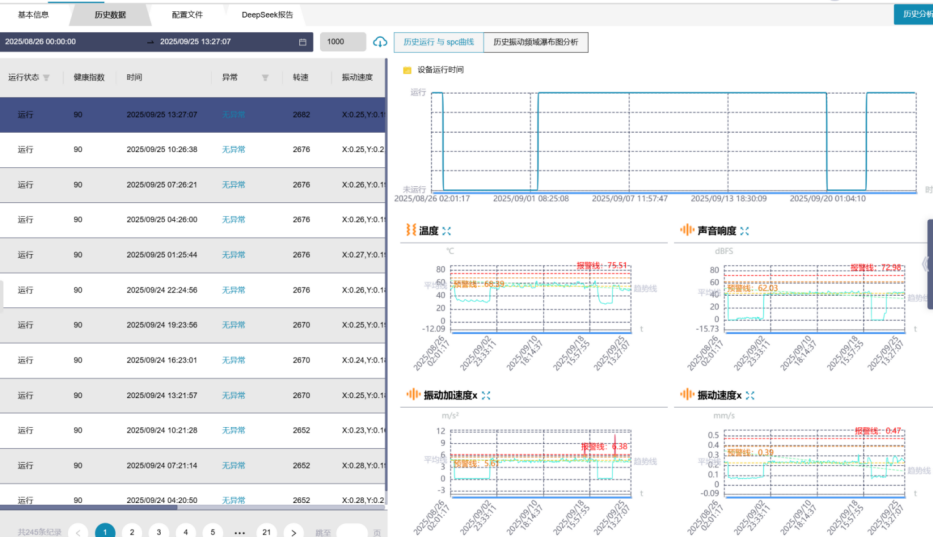
Figure 2-22 Historical data screen
Daily Management -> select a unit -> select a point -> Historical Data. This page shows the last few months of historical data and allows filtering by changing the start and end times.
The historical data list provides filtering by operating state, complete data and complete diagnosis process.
- Click the filter marker after “Operating state” and choose “Yes” to show running data, or “No” to show non-running data.
- Click the filter marker after “Complete data” and choose “Yes” to show historical data whose time-domain data can be viewed; only when the historical data is complete can you download the time-domain data using the Download icon

.
- Click the filter marker after “Complete diagnosis process” and choose “Yes” to show data that went through the full diagnosis process; only such data has fault diagnosis results.
The last column of the historical data list provides data download; click the download icon

to download a data archive. Note that time-domain data can only be downloaded when the data is “complete”.
The right-hand column of the Historical Data page provides historical operating and SPC curves and a historical vibration frequency-domain waterfall analysis.
Click the “Historical Analysis” button at the upper right to view the basic operating results and various charts of that historical record.
For example:
Vibration SPC chart
Check whether the XYZ vibration velocity is within the control lines. When all three axes are within the control lines, vibration is normal. When the vibration velocity SPC chart is abnormal, determine the maximum vibration velocity and derive vibration severity per ISO10816; if severity is normal, continue observing later indicators, and if severity is poor, inspection is recommended.
Analysis of the chart above: the XYZ vibration velocities are all within the control lines, so vibration is normal.
Temperature SPC chart
Check whether the temperature is within the control lines.
Analysis: the operating temperature is within 28.05-46.51 degrees Celsius, so operating temperature is normal.
Loudness SPC chart
Check whether the sound loudness is within the control lines.
Analysis: the operating sound loudness is within 19.45-199.71 dB, so sound loudness is normal.
2.4 Configuration File
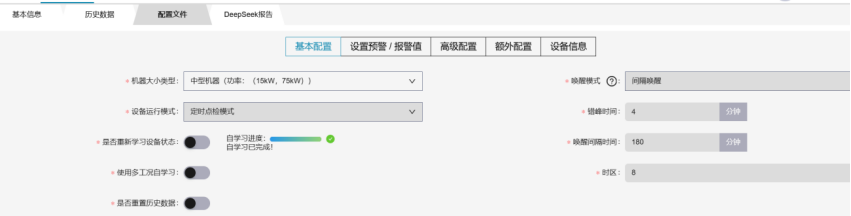
Figure 2-28 Configuration file screen
The Configuration File page provides basic configuration and advanced configuration settings; see section 1.3 “Sensor Configuration” for details of the configuration items.
2.4.1 Setting Warning/Alarm Values
There are two ways to set these:
Method 1: The sensor device has a self-learning function (5 days of data learned by default); the algorithm calculates a warning or alarm line from historical data without manual intervention.
Method 2: The user sets the warning and alarm values manually, and the system uses these settings; the warning and alarm lines affect the maintenance advice.
Values above the warning line are shown in orange, and values above the alarm line in red.
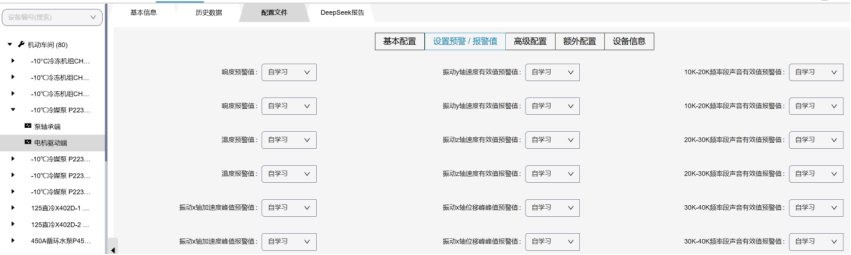
Figure 2-29 Setting warning/alarm values
2.4.2 Additional Configuration (RS485/Wi-Fi)
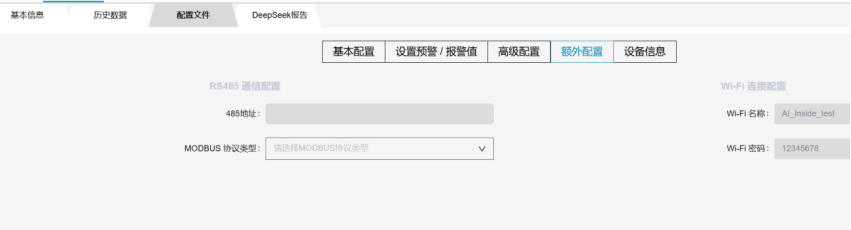
Figure 2-30 Additional configuration screen
On the Additional Configuration screen, users can configure the 485 address for sensors with 485 capability and Wi-Fi settings for Wi-Fi-communication sensors.
2.5 Viewing Diagnostic Reports
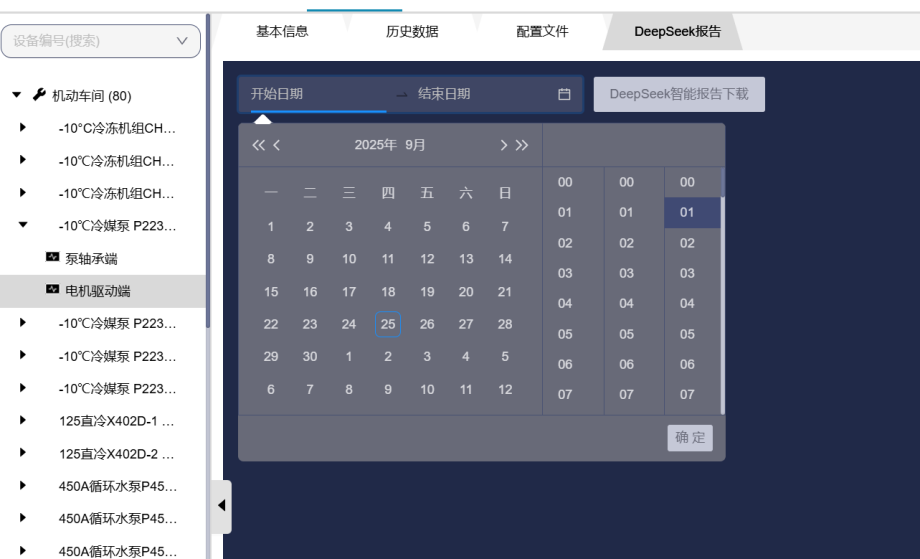
Figure 2-31 DeepSeek report download page
The platform has integrated DeepSeek (as shown in Figure 2-31) and provides a DeepSeek intelligent diagnosis report for a single point at the sensor level. After entering the DeepSeek report page shown in Figure 2-31, choose the start and end dates on the left, then click “Download DeepSeek intelligent report” on the right; the data within the selected time range is analyzed and a diagnostic report file is generated.
3 User Management
3.1 Creating Customers
3.1.1 Creating a Customer Administrator Account
On the factory screen, choose User Management to manage customers (create customer, delete customer, manage assets for customer users).
On the User Management screen, click Create User and fill in the user name, email and mobile number to add a customer.
After the user is created, a prompt asks you to add the user first; choose Cancel here and return to User Management (User Group) to allocate assets for the customer first, then add the user account.
Click a specific user -> Manage Assets button, then select the assets to allocate to the customer user.
3.1.2 Creating Customer Sub-accounts
On the user asset-allocation screen click

-> Create User -> fill in the user-group details and allocate permissions and activation method -> jump to the activation prompt screen (Activate) -> create user name and password (the password must contain one uppercase letter, one lowercase letter, one special character and eight digits) -> done.
To create multiple sub-accounts, simply continue creating accounts on the User Management screen following the steps above. All account details are shown on the User Management screen.
3.2 Personal Settings
- Platform name: shown in the upper left after login.
- Platform logo: shown in the upper left after login.
- Language selection: choose the Chinese or English interface.
- Large-screen monitoring function: enables the large-screen monitoring feature when turned on.
3.3 HTTP Data Push Settings
Click the “Administrator” avatar, then click the “Data Sending” button to jump to the data-sending selection screen (Figure 3-5), where an interface for setting HTTP addresses appears (Figure 3-6). A user can set up to three addresses. When adding a URL, we simulate pushing data to the configured URL and require a response within 3 seconds; otherwise the URL is considered invalid and is not added.
4 Alarm List
4.1 Alarm List Query
The alarm list shows the fault-alarm details of all installed monitoring objects, displayed in the alarm-details column so users can preview all abnormal alarms from the device perspective and view the diagnostic result data of the abnormal event.

Figure 4-1 Multi-level alarm list screen
Click “Multi-level alarm list” in the top navigation bar to open the screen shown in Figure 4-1.
Filtering: use the time selector (upper left) to filter alarm records within a specific time range. The table shows the most recent alarms by default (30 days of data) and supports paging.
Jump to device details: click a device name to view that device’s details.
Export alarm list report: choose a time range at the upper left and click “Export alarm list report”; the system generates an Excel file and downloads it automatically.
4.2 Handling Alarms
Find the record to handle in the alarm list and click the “Edit” icon in the Actions column.
In the dialog that appears, fill in:
- Handling feedback: describe the action taken or the result;
- Handler: enter the person in charge; click “OK” to submit.
4.3 Configuring Push Rules
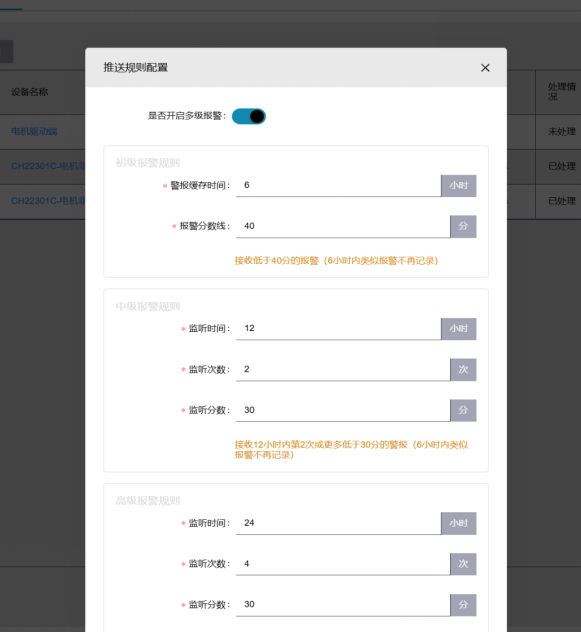
Figure 4-3 Push rule configuration screen
Setting alarm trigger conditions: click the “Push rule configuration” button at the top of the page and configure in the dialog. By default only the primary alarm is enabled.
Primary alarm rule: cache time (hours) — the interval at which repeated alarms are pushed; alarm score line (points) — the minimum score that triggers an alarm.
Intermediate/advanced alarms (optional):
- Turn on the “Enable multi-level alarm” switch.
- Fill in the listening time, count and score.
- Click “OK” to save the configuration.
4.4 Managing Recipients
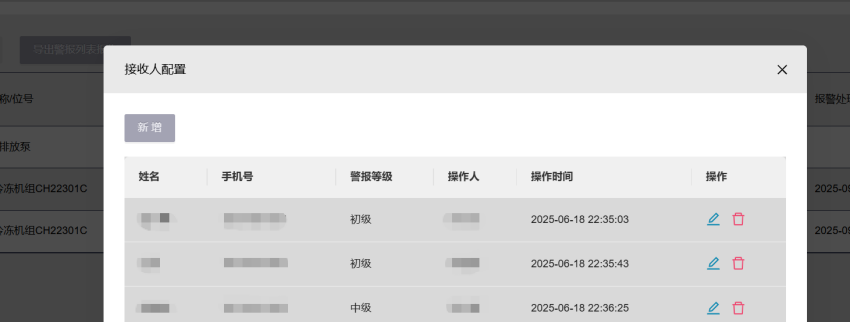
Figure 4-5 Recipient configuration screen
Adding a recipient:
- Click the “Recipient configuration” button to enter the recipient list.
- Click the “New” button.
- Fill in the information — basic information: name, mobile number, push level (primary/intermediate/advanced); push method: tick SMS, WeCom or DingTalk push; asset scope: select factories, workshops or units in the tree component (multi-select supported). Click “OK” to save.
Editing or deleting a recipient: find the target record in the recipient list; to edit, click the “Edit” icon, change the information and save; to delete, click the “Delete” icon and confirm.
5 Diagnostic Reports
5.1 Standard Reports
This module provides diagnostic-report export at the unit level. Click the Diagnostic Report button, choose the data statistics time range and a diagnostic report for the specified period is generated.
The platform has now integrated DeepSeek (see Figure 2-26) and provides a DeepSeek intelligent diagnosis report for a single point at the sensor level. After entering the DeepSeek report page shown in Figure 2-27, choose the start and end dates on the left, then click “Download DeepSeek intelligent report” on the right; the data within the selected range is analyzed and a diagnostic report file is generated.
5.1.1 Report Download
Select the factory-level directory and click Export Device Monitoring Report to export, by month, the monitoring statistics report of all devices at the factory level.
This report permission is limited to tenant administrators.
5.1.2 Expert Analysis Report
You can view the charts under operating status and real-time mode and export raw data from Historical Data for your own analysis; you may also contact our staff for a more detailed expert analysis report.