Industrial IIOT data platform
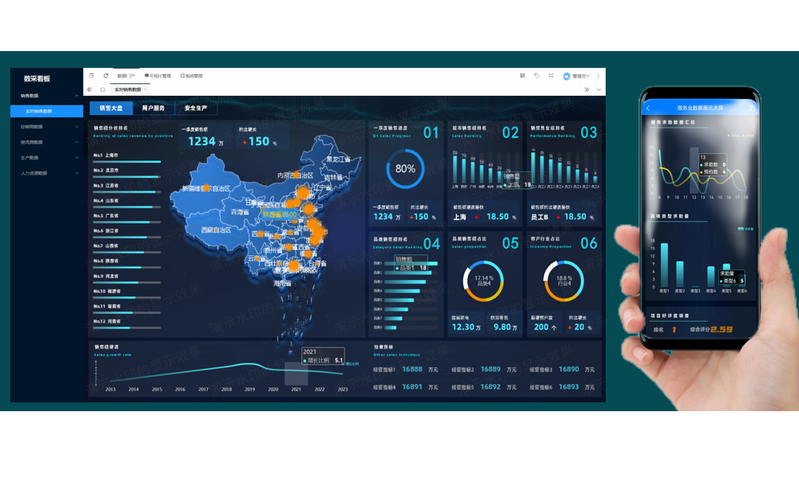
Industrial IoT Data Visualization Dashboard Software | Real-Time Data Monitoring & Reporting Platform with Drag-and-Drop Design (Private Deployment)
Get a Quote1 Product Overview
2 Service Concept
Our company solemnly promises:
You buy not only the product, but also the meticulous and thoughtful technical support service ! ! ! ( =^_^= )
This product only needs ordinary workers to install it on site! No debugging is required!
We provide free remote guidance, remote configuration and debugging services, and send data to the user’s designated cloud platform.
Free IoT solution consulting services!
3 Product Features and Advantages
-
Drag-and-drop design allows quick response to changing business needs; low-code secondary development allows easy satisfaction of personalized needs.
-
Rich data sources: relational databases, big data components, data files, external data APIs, the Internet of Things, etc.
-
Drag-and-drop design: Flexible combination, design data visualization reports like a puzzle, what you see is what you get.
-
Multi-terminal support: Supports designing large-screen visualization for display terminals with different resolutions, such as computers, mobile phones, pads, and splicing screens.
-
Configure interaction: Configure to realize click, jump, pop-up window, drill down, chart linkage, data filtering and other interactive needs.
-
Report push: fully automatically pushed to enterprise WeChat groups, DingTalk groups, Email, large-screen devices and other channels.
-
Intranet privatization deployment: independent control of data security.
4 Product Features
System functional architecture
4.1 Data access
| First level function | Secondary sub-function | Functional Description | | | | |--------------------------|----------------------------------------------------------------------|---------------------------------------------------------------------------------------------------------------------------------------------------------------------------------------------------------|------------------------------------------------------------------------------------------------------| | Real-time data access | Business system push | HTTP PUSH, push data to the visual dashboard in real time, single screen or group batch push. | | | | | | | | IoT platform push | Support MQTT, access to EMQX and other IoT middleware | | | | | Database access | Database data source | Theoretically supports all databases connected by JDBC and HTTP API | | | | | | | | SQL Datasets | Write SQL statements (the editor supports code prompts), and use query results as chart data; support paging query and data permission filtering; support custom data conversion and custom formatting; | The dataset supports being used as a data API for other systems to call | | Dataset Access | HTTP API | Access third-party HTTP API data, support dynamic parameters, custom headers, custom data parsing and conversion, equivalent to a crawler | | | | | | | | Data files | Supports Excel (multi-sheet), JSON, CSV, XML and other file formats. Supports local upload and reading of files in the specified directory on the server. | | | | | | | | Online Form | Use tables online to maintain data, just like using office software Excel | | | | | | | | JSON text | Dynamic parameters, result preview, field formatting | | | | | | | | CSV Text | Dynamic parameters, result preview, field formatting | | | | | API Online Development | Multiple data sources, database query and data conversion processing | Such as: filtering by conditions, paging, etc., interfaces for obtaining data from the database | Online development, real-time effect, can be used as a data API interface rapid development platform | | | | | Third-party data capture, conversion and processing | For example: online development calls third-party APIs, web pages, etc. to crawl data, data parsing and conversion interfaces, a more free crawler | | | | | | | | File Reading | For example: Develop and read the Excel file data specified in the server | | | | | | | | Download the file | Such as: developing data export interface, etc. | | | | | | | | Scheduled tasks | Execute various data processing tasks regularly. For example, extract business system data regularly and push it to the data dashboard | Lightweight data ETL tool | | Form Data Collection | Custom Forms | Create your own data collection form | Not supported yet | | | | | Form Collection | Publish a form to allow users to fill in data; query form data, etc. | Not supported yet |
4.2 Visual Design
| First level function | Secondary sub-function | Third level sub-function | Functional Description |
|---|---|---|---|
| Design assets | Image assets | ||
| Upload design materials | |||
| Font assets | |||
| Upload fonts | |||
| Map Data | |||
| Adding map data | |||
| Animation | |||
| Upload a custom animation page | |||
| Chart Management | Create a chart | ||
| Dataset to Chart 0-Code Conversion | |||
| Starting with V3.6.0, the zero-code data binding function in the designer is preferred. | |||
| Custom chart plugins | |||
| Customize personalized chart plug-ins to meet the needs of business personnel to create charts without coding | |||
| Kanban Management | Create a dashboard | ||
| Basic information, dashboard grouping, etc. | |||
| Edit basic information of the dashboard | |||
| Modify basic information | |||
| Data push robot | |||
| Configure a data push robot to allow the business system to push data to the big screen in real time | |||
| Copy board | |||
| One-click copy board | |||
| Dashboard Short URL | |||
| One-click copy of the short URL of the dashboard | |||
| Import/Export Dashboard | |||
| One-click export and import of data dashboards to facilitate dashboard migration and publishing between different environments | |||
| Share Board | Specify viewing permissions | The designed data screen/dashboard is shared with users who need to view it, supporting multiple sharing strategies: public viewing, logged-in user viewing, specified user viewing, password viewing, IP whitelist, etc. | |
| Design Dashboard | Drag and drop designer | Add dozens of large-screen components such as required charts, texts, pictures, videos, etc. with one click. | |
| Design Photo Gallery | Quickly select design images from the design image library | ||
| Global Parameters | The parameters passed in the URL will be synchronously passed to all charts, and it supports obtaining parameters through expressions | ||
| Design guide lines | Alignment Assist | ||
| Layer management | Cascading order to achieve personalized display effect | ||
| Layer Copy | Support cross-screen copying and shortcut key operation | ||
| Source code editing mode | Can export and import design configuration source code | ||
| Instant push | Support configuration of instant push connection information | ||
| Large screen watermark | Supports custom watermarks, which are displayed when users browse the large screen | ||
| Multi-terminal support | Customized resolution, suitable for PC, mobile, PAD, splicing screen and other special resolution screens | ||
| Zero-code data binding | No coding required to bind charts and data | ||
| Design Components | Chart Components | Common charts + custom charts | |
| Map Components | Common map types + custom maps | ||
| Text Component | Text components such as text, hyperlinks, rich text, and graphic lists | ||
| Media Components | Media components such as pictures, videos, surveillance video streaming, carousel focus pictures, warning messages, picture browsing, etc. | ||
| Indicator Components | Data cards, dashboards, progress bars and other indicator components | ||
| Table Component | Basic forms, complex forms, etc. | ||
| Decorative components | Components such as borders, decorations, etc. | ||
| Interaction Components | Interactive components such as query form, tab page, tab focus image, countdown, 3D carousel, etc. | ||
| IoT Cloud Configuration Components | Fluid pipelines, flying objects, etc. | ||
| Integrated components | Data portal components, predefined charts, and more | ||
| Visual template library | |||
| Large screen template | |||
| Official Template Library | |||
| Chart template | |||
| Official Template Library | |||
| Code templates | |||
| Official Template Library |
4.3 Automatic push of data dashboard
4.4 Large screen display
The product supports mobile phones, computers, splicing screens and other hardware large-screen display devices
| First level function | Secondary sub-function | Functional Description |
|---|---|---|
| Enterprise WeChat Group | Supports automatic sending of designated bulletin boards at regular intervals | |
| DingTalk Group | Supports automatic sending of designated bulletin boards at regular intervals | |
| Supports automatic sending of designated bulletin boards at regular intervals | ||
| Large screen devices | Supports automatic sending of carousel signage at regular intervals | |
| External business system | Supports automatic sending of carousel boards and custom messages at regular intervals | |
4.5 Data Portal
You can view data reports anytime and anywhere in the mobile APP client
4.6 Low-code expansion
| Open Capabilities | Secondary sub-function | Functional Description |
|---|---|---|
| Low-code online development | Data API | |
| Custom charts | Based on Echarts, the learning cost is extremely low, and the official website continues to update examples | |
| Custom VUE components | Based on Vue2, low learning cost, abundant materials, and the official website continuously updates examples | |
| Custom Maps | Based on Echarts + Geojson, Tianditu, Amap, Baidu and other map open APIs | |
| Developing chart plugins | Based on JS, independently develop extended chart types to quickly convert data into charts | |
| Develop custom pages | Based on HTML, CSS, JS and other front-end technologies |
4.7 System Management
| First level function | Secondary sub-function | Functional Description |
|---|---|---|
| Basic Management | Organization | Institutional sector data |
| People Management | Personnel data | |
| Role Management | Custom roles | |
| Role permission management | Assigning functional permissions and data permissions |
5 Project Implementation Process
The project implementation of this product can be divided into the following steps: data collection, design material uploading, visual design, report publishing, etc.
Project implementation process diagram
6 Typical Cases
❓ Frequently Asked Questions (FAQ)
1. What is an industrial data visualization dashboard?
It is a software platform that converts industrial data into visual charts, dashboards, and reports for real-time monitoring and decision-making.
2. Does it support SCADA or ERP system integration?
Yes. The system supports integration with SCADA, ERP, OA, and industrial databases via API, Excel, and standard data formats.
3. Can I design dashboards without coding?
Yes. The platform supports drag-and-drop no-code design, allowing users to create dashboards easily without programming skills.
4. What devices can display the dashboard?
It supports Windows PCs, Android devices, industrial tablets, and large-screen display systems with adaptive resolution.
5. Does it support private deployment?
Yes. The software can be deployed on local servers or industrial computers, ensuring full data privacy and security.
6. What types of data sources are supported?
It supports Excel, CSV, databases, ERP systems, OA systems, and REST API-based data sources.
7. Is it suitable for industrial IoT applications?
Yes. It is widely used in IoT platforms, smart factories, and industrial monitoring systems for real-time data visualization.
8. Can multimedia content be displayed?
Yes. The system supports images, videos, maps, and custom UI components for rich visualization scenarios.
🚀 Call To Action (CTA)
Transform your industrial data into real-time insights with a powerful visualization platform.
👉 Request Demo Version
👉 Get Technical Documentation
👉 OEM / Custom Dashboard Development Available
👉 Contact Us for Project Integration Support